
The United Nations Conference on Trade and Development (UNCTAD) has published the 2021 edition of the Review of Maritime Transport (RMT). The report tracks global trade, shipping and ports annually since 1968.
Here are some of the highlights.
Maritime Trade Growth
The traditional notion that the world maritime trade grows (or shrinks) faster than GDP has been challenged by the data, especially after 2015. Maritime trade-to-GDP ratio was indeed greater than 1 from 2006 to 2014, but fell below the threshold after 2015. UNCTAD projects compound annual maritime trade to grow by 2.4% in 2022-2026, down from 2.9% over the past two decades.

Figure credits: RMT 2021, UNCTAD, based on various sources
World Fleet
The global commercial shipping fleet increased by 3% in 2020, reaching 99,800 ships of 100 gross tons and above and 2.13 billion dwt. According to Clarksons Research data, by February 2020, the merchant fleet surpassed the symbolic 100,000-vessel mark for the first time in history.
However, partly due to Covid-19 shipyard disruptions and market uncertainty, the delivery of newbuilds decreased by 12% in 2020. Orders for new ships declined by 16% over the year, which is expected to considerably limit fleet growth in the next 12 months. The ordering hesitancy of 2020 was reversed in 2021 with a surge of new newbuilding contracts, especially in the red-hot segments of bulk carriers, container ships and LNG carriers.
At 71.8%, bulk carriers and tankers together represent the world fleet’s dominant ship types in dwt terms, but in 2021 it is the fleet of LNG carriers that is growing the fastest at 5.12%

Table credits: RMT 2021, UNCTAD, based on data from Clarksons Research
Shipbuilding
As in previous years, world shipbuilding deliveries are concentrated in just three countries. In 2020, the combined market share of China, South Korea, and Japan reached 93%, up from 92.5% in 2020 and 90.1% in 2019.

Table credits: RMT 2021, UNCTAD, based on data from Clarksons Research
Sky-high freight rates and world inflation
At the onset of the pandemic in 2020, tanker rates increased markedly on the back of the oil price collapse and strong demand for floating storage. A few months later, they collapsed and have not fully recovered yet.
On the other hand, as the UNCTAD report highlights, the story is completely different in the other sectors, mainly container ships: “Since the second half of 2020, there has been an increase in freight rates. While demand for containerized goods has been higher than expected, shipping capacity has been constrained by logistical hurdles and bottlenecks and shortages in container shipping equipment”. On top of that, port congestion and unreliable schedules resulted in added costs for shippers, such as detention fees and demurrage.
As the China Containerized Freight Composite Index (CCFI) is up 243% from August 2020 to August 2021, the report modeled the impact of increased container freight rates on countries’ inflation rates, with a particular focus on three groups of developing countries: Least Developed Countries (LDCs), Landlocked Developing Countries (LLDCs), and Small Island Developing States (SIDS). Due to their reliance on maritime transport, the hardest hit will be SIDS, with an expected 24% import price increase in a one-year horizon, and a 7.5% consumer price increase.

Figure credits: RMT 2021, UNCTAD, based on various sources
Crew-change crisis
The Covid-19 pandemic travel and health protocols caused a worldwide disruption for seafarers. According to the BIMCO/ICS Seafarer Workforce Report 2021 quoted by the RMT 2021, there are 1,892,720 professionals working on ships, up from 1,647,494 in 2015. The top countries providing seafarers can be seen in the table below.

Figure credits: RMT 2021, UNCTAD, based on ISF and BIMCO Seafarer Workforce Report 2021
However, the crew-change crisis is far from over. “Even over a year into the pandemic, due to these restrictions, and the shortage of international flights, according to latest estimates by the International Chamber of Shipping, around 250,000 seafarers remain stranded, far beyond the expiration of their contracts. Yet, there is still no global consensus on uniform measures to allow for efficient crew changes and transfer”, the report said.
Port call indicators
The report showed a variety of new key performance indicators (KPIs) for ports. For example, median time in port for container ships (0.71 days) is a third of time in port for dry bulk carriers (2.07 days). Looking at countries, with 74,413 container vessel arrivals, China has almost double the port calls of the second place, Japan (37,969 calls). However, Japan boasts the lowest median time in port (0.34 days, or just 8 hours).
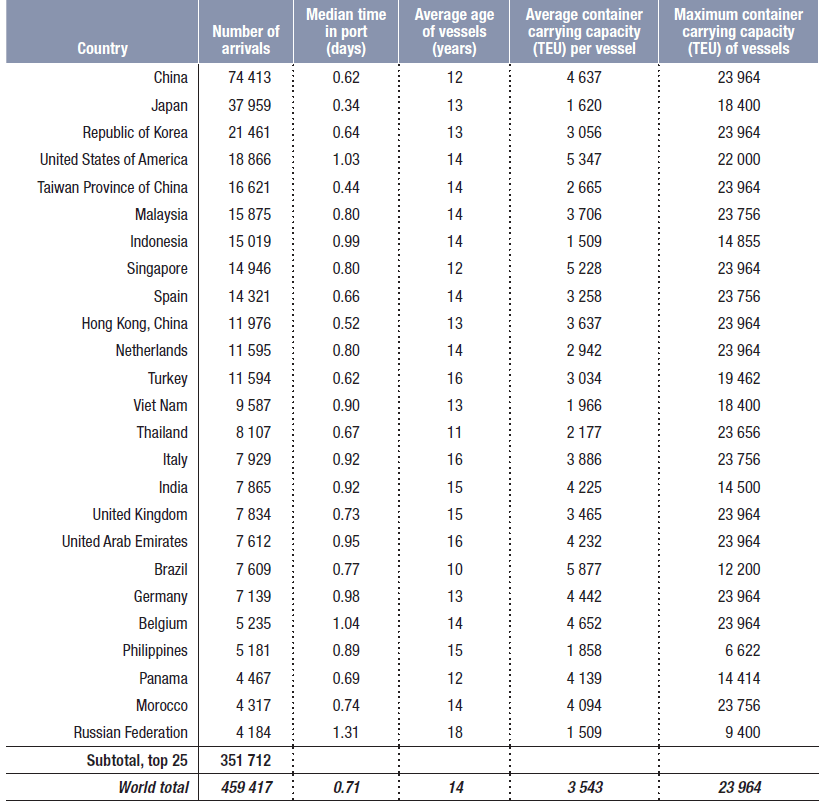
Figure credits: RMT 2021, UNCTAD, based on data provided by MarineTraffic
Since vessel size is also important in this analysis, it should be expected that lower average container capacity per vessel would result in lower times in port, but this relationship is not linear. As the report points out, “ports that can handle larger ships also tend to be more modern and better equipped”. As a result, “some of the fastest turnarounds are in countries that have very few port calls and only receive ships with a few containers to be loaded and unloaded, so there is little congestion. However, at the other end of the scale, turnarounds are also fast in countries that have many port calls and can accommodate the largest container vessels”. This can be seen in the figure below.

Figure credits: RMT 2021, UNCTAD, based on data provided by MarineTraffic
Decarbonization
The UNCTAD report is published on a week sandwiched between COP26 in Glasgow and the IMO’s forthcoming Marine Environment Protection Committee meeting (MEPC 77). As the report stresses, “the shipping industry has an important part to play in combatting climate change. The Paris Agreement aimed to reduce global warming to well below 2°C and pursue 1.5°C. But, despite a brief dip in carbon dioxide emissions caused by the COVID-19 pandemic, the world is still heading for a temperature rise in excess of 3°C this century”.
Although COP26 did not deliver much, stakes at high for MEPC 77, after MEPC 76 in June 2021 yielded an agreement on the basic design of short-term decarbonization measures, the EEXI and CII indexes. There are ever-growing calls for a commitment to full decarbonization by 2050, a bold goal opposed by most developing countries, but supported by major shipping nations, such as Denmark, Norway, the US, Germany, Panama, and others.
However, as temperatures keep rising, “urgent action is needed on both mitigation and adaptation”, concludes the UNCTAD document.
Priorities for action
Finally, the document puts forward 10 priorities for the current maritime agenda:
- Vaccinate the world
- Revitalize the multilateral trade system
- End the crew-change crisis
- Vaccinate seafarers
- Facilitate crew changes
- Ensure reliable and efficient maritime transport
- Mainstream supply chain resilience, risk assessment and preparedness
- Control costs
- Decarbonize
- Climate-proof maritime transport
The report features much more data and analysis, including some based on new datasets and improved visualization tools.
You can download the RMT 2021 full-text pdf version here.
__________________
Subscribe to our Weekly Newsletter and get the best of Latin America’s maritime business. It’s free!
