
The United Nations Conference on Trade and Development (UNCTAD) has published the 2021 edition of the Review of Maritime Transport (RMT). The report tracks global trade, shipping and ports annually since 1968.
Maritime South has published a summary of the document. But what about the highlights for Latin America and the Caribbean (LAC) ports?
The LAC region has underperformed world economic growth over the last two years. World gross domestic product (GDP) increased by 2.5% in 2019 and decreased by 3.5% in 2020, due to the Covid-19 pandemic. Meanwhile, the LAC change was -0.1% and -7.1%, respectively. For 2021, the UNCTAD projects s slight edge in relation to the global average, as world GDP grows by 5.3% and LAC GDP grows by 5.5%.
Brazil remains a powerhouse for dry cargo supply, mainly grains and iron ore. The country’s weight is particularly visible in the capesize segment, where Asia dominates demand. In 2020, China accounted for 76% of world iron ore imports and 20% of coal imports. Capesize cargoes’ supply is keenly disputed between Brazil and Australia. In ton-miles terms, Australia accounted for around 35% of the 2020 trade, while Brazil, around 31%.

Figure credits: RMT 2021, UNCTAD, based on VesselsValue data
In the grain export market, Brazil (23% market share) and the US (26%) are the main players. Argentina follows in third, at 11%. Colombia retains a relevant place in the coal export trade with a 5% market share, corresponding to the 6th place in global rankings compiled by UNCTAD. The world leader is Indonesia at 35%, closely followed by Australia with 31%.
Waiting times vary considerably. “In Colombia, the average waiting time for unloading is one day while in Brazil it is five and a half days. Brazil also has the highest waiting times for loading – on average more than a week”, says the report. Worldwide highest, that is.
UNCTAD tracks countrys’ container connectivity through the Liner Shipping Connectivity Index (LSCI) since 2004. In 2019, the methodology was updated and improved, in collaboration with MDS Transmodal. The data has been published quarterly ever since.
The Q3 2021 LSCI data shows that the best-connected country in Latin America and the Caribbean is Panama, with an LSCI of 51.25. Following on the top 10 are Colombia (50.16), Mexico (47.61), Dominican Republic (43.37), Peru (41.11), Ecuador (38.19), Bahamas (38.11), Brazil (37.73), Chile (37.49), and Guatemala (37.44). Smaller economies are prominent in the ranking due to the presence of relevant transshipment hubs in their territories.
All top 10 countries worldwide, however, have an LSCI above 80, with China widening its lead over the years.
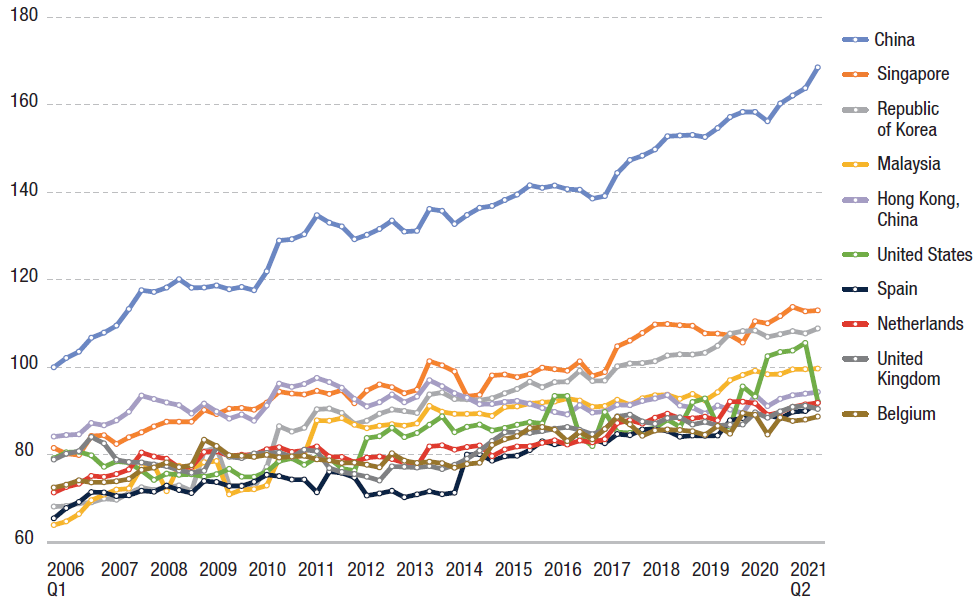
Figure credits: RMT 2021, UNCTAD, based on data provided by MDS Transmodal
The LSCI also tracks individual ports, where the best-connected LAC port is Cartagena, Colombia.
Connectivity, however, is different from performance. Of the top individual ports ranked by the new World Bank IHS Markit Container Port Performance Index (CPPI) and compiled by UNCTAD, the only LAC port is Mexico’s Lazaro Cardenas, in 25th place. The index combines data on vessels, their port calls and the cargoes they load and unload, as well as the time they spend in ports, to rank the ports’ performance.
The report also highlighted differences between types of terminals in Latin America and the Caribbean. According to an analysis performed by UNCTAD affiliate Economic Commission for Latin America and the Caribbean (ECLAC or CEPAL), the region features a total of 1,967 maritime logistics facilities across 50 countries and territories.
Of these, 64% are ISPS Code-certified. A total of 982 facilities handle cargo or passengers, while 277 provide other services, such as shipbuilding, ship repair, among others.
The top 5 countries in number of port terminals are Brazil, with 306, Mexico (171), Argentina (143), and Chile and Peru (97 each).
The types of terminals vary between sub-regions too. For instance, passenger terminals are proportionately more relevant in the Caribbean, while dry bulk terminals are proportionately more relevant in South America.

Figure credits: RMT 2021, UNCTAD
Two additional trends were highlighted by the RMT 2021. The continued increase in vessel size and market consolidation, as seen, for example, in Chilean container ports. Chile’s maximum vessel size, measured in TEU, grew by more than 300% between 2006 and 2021. Meanwhile, the number of liner companies calling local terminals decreased markedly, from 25 in 2012 to 16 in 2021.

Figure credits: RMT 2021, UNCTAD, based on data provided by MDS Transmodal
You can download the RMT 2021 full-text pdf version here.
__________________
Subscribe to our Weekly Newsletter and get the best of Latin America’s maritime business. It’s free!
