
As the world experiences the first stages of the energy transition towards a truly zero carbon economy, the maritime sector tries not to stay behind. There is urgent need for innovative technologies, comprehensive financing schemes and a sound international regulatory framework. Those are all works in progress. However, a key question remains: how long will the transition take?
In the early 1800s, the transition from sail to steam started with smaller inland and coastal vessels, and ships moving fuel (coal at the time) were also among the first to adopt it as energy source for their own propulsion. This pioneering fleet was less exposed to the limited bunkering infrastructure, either because the routes were shorter or because the vessel was already carrying the new fuel in its holds. For the current transition, the same applies. That is why we see the current alternative fuel fleet dominated by ferries, offshore vessels and LNG carriers, with some LPG carriers (fueled by LPG) and some chemical carriers (fueled by methanol) showing considerable growth. However, in gross tonnage (GT) terms, LNG carriers currently dominate the landscape, since they are not only more numerous, but also much larger than the rest of the alternative fuels fleet.
According to Clarkson Research data published last November by various sources (see Splash’s take here), around 3.5% of the world fleet above 2,000 GT is capable of burning alternative fuels. Approximately 3% are LNG carriers, with LNG fueled (excluding LNG carriers) reaching 0.4% and battery-electric/hybrid propulsion reaching 0.1%.
If we were the determine the first year of the transitional period we currently find ourselves in, the early 2000s could provide strong candidates. That was when LNG carriers started using dual fuel diesel engines, while at the same time the first LNG fueled coastal ferries were launched in Norway.
However, the growth from scratch in this early adoption phase is rather slow, as in any technological transition. The borders are also blurred. Should we then just adopt the year the first sea-going “green” vessel hit the water? Was it when the first LNG fueled vessel (excluding LNG carriers), the Norwegian ferry Glutra, entered service in 2000? Was it when the Methane Princess entered service in 1964, since she was propelled by dual fueled steam turbines, making her the first ship propelled by LNG? Or was it truly when the first zero emission (battery-electric) ferry, the Ampere, was launched in 2015?
It can’t be any of those simply because a handful of vessels are not enough to signal a major transition. If we were to use such criteria, we could argue that the age of sailing ships never ended, because there are a few ocean-going traditional cargo sailing vessels operating until today.
Therefore, there should be a threshold when the new technology reaches a more visible and relevant critical mass so that it’s possible to proclaim the transition as “maturing”. Usually, in innovation diffusion research, this means a 10% adoption. After that, the technology transition proceeds much faster. For shipping, this could be translated as the moment the world fleet equipped with alternative fuel technology reaches 10% by gross tonnage.
A simple way of modelling technological transition is to use the logistic function*. It has been used with considerable success over the last few decades, especially in the 80s and 90s by Nebojsa Nakicenovic and Arnulf Grübler of Laxenburg, Austria’s IIASA. In The Rise and Fall of Infrastructures (1990), Grübler showed that the transition from sail to steam and then to the internal combustion engine were remarkably adherent to the logistic curve. He then estimated the time it took for the world fleet to move from 90% renewable power (wind) to 10% (fossil fuels): 55 years. In the same book, he reproduces a revealing image from an earlier work by Nakicenovic, showing the substitution pattern for the UK-flagged fleet.
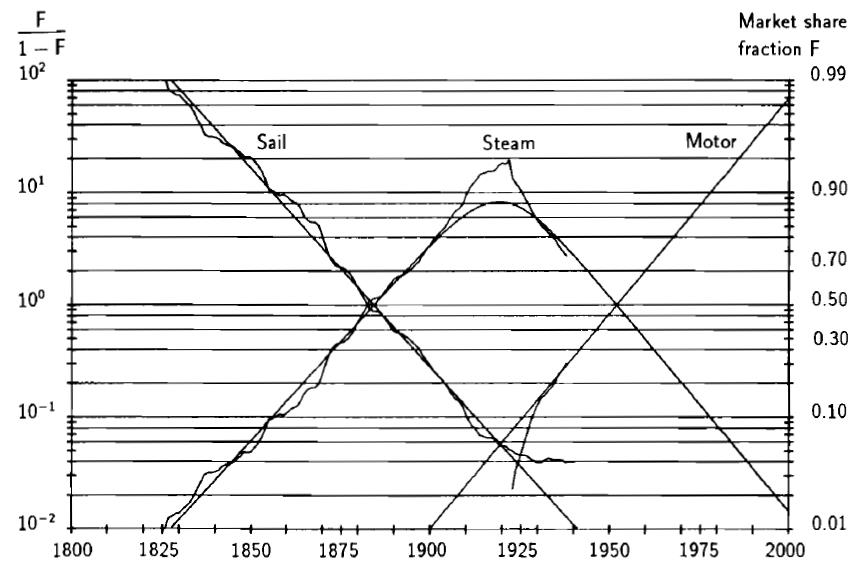
Martin Stopford, another well regarded author in the field, reached a similar time span. In Maritime Economics (2009), he comments that “the transition from sail to steam took over 50 years”, although clippers showed remarkable resilience, since “the last merchant sailing ship, the Elakoon, was not converted to motor power until 1945”.
Back to 2021. This current transition is not exactly the same as the previous ones. It is not mainly about increasing reliability and cost reduction as before. This time it’s about an environmental crisis, or urgency, as some would argue. It is driven by increasingly strong market sentiment against fossil fuels and in favor of decarbonization. It is also backed by ever stricter GHG regulation in all spheres: national, regional and (soon-to-be-seen at the IMO level) global. Therefore, we should expect a shorter transition.
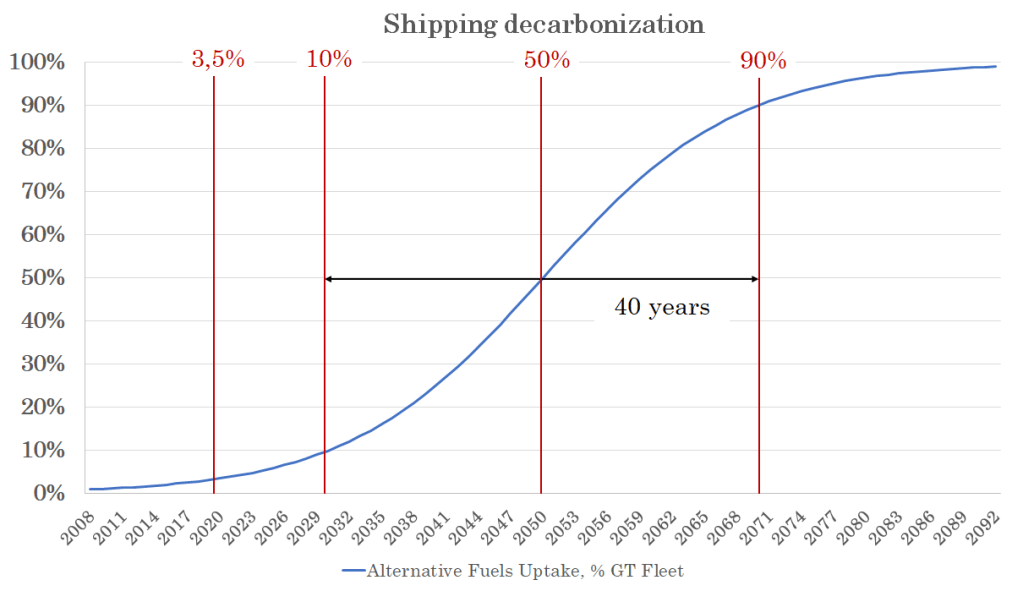
From the current penetration of 3,5% alternative fueled ships and applying 2050 as the year we expect to have at least 50% of the fleet with alternative fuels (driven by expected regulation), the logistic function provides a transition time of 40 years, ending 50 years from now. We should expect a 10% market penetration of alternative fueled ships by the end of this decade and 90% by 2070.
This model, like any other, is embedded with limitations and simplifications. We could of course accelerate this transition, especially by cleverly designing stricter regulation and incentives for cleaner vessels.
It should be also noted that the curve above is not necessarily correlated to the world fleet’s emissions. The majority of alternative fueled vessels are expected to be dual fueled, which means they could still burn fuel oil. On the other hand, LNG in particular and even conventionally fueled ships could reduce their emissions by blending biofuels, carbon capture or offsetting. Modern LNG fueled vessels (with minimized methane slip) currently provide only a maximum of 20% GHGs well-to-wake reduction. Some technologies already push this to almost 50%.
Still, any path to a net zero future depends on developing technologies, such as wind assisted propulsion, green methanol or green ammonia as bunker fuels. The best long-term solution remains the deployment of zero emission ships as soon as possible. The year 2070 might be too late.
_______________________________________________________
*The logistic function is a three-parameter simple tool for modelling exponential growth in a limiting environment. When plotted in the usual linear scale, it’s S-shaped. When plotted in a logarithmic scale, it’s linear. The curve is expressed mathematically as:
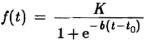
Where b is the growth rate, t0 is the inflection point and K is the saturation point. For our model, b = 0,11, t0 = 2050 and K = 1 (transition 100% completed).
Also, we define:
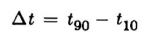
As the interval between 10% and 90% adoption rate. Since the curve is symmetric,
Therefore, for b = 0,11, ∆t ≈ 40.
The logistic modelling is not without its setbacks. As a simple and symmetric model, it doesn’t incorporate the possibility of an abrupt change of environment. For example, such a change might be associated with the introduction of regulation banning certain types of propulsion systems or fuels in the future.
References
Grübler, A. (1990) The Rise and Fall of Infrastructures, Physica-Verlag Heidelberg.
Nakicenovic, N. (1984) Growth to Limits, Long Waves and the Dynamics of Technology. Dissertation an der Sozial- und Wirtschaftswissenschaftlichen Fakultat, Universitat Wien.
Stopford, M. (2009) Maritime Economics, 3rd Edition. Routledge, New York.
__________________
Subscribe to our Weekly Newsletter and get the best of Latin America’s maritime business. It’s free!

Nice blog thanks for pposting
LikeLike